The challenge
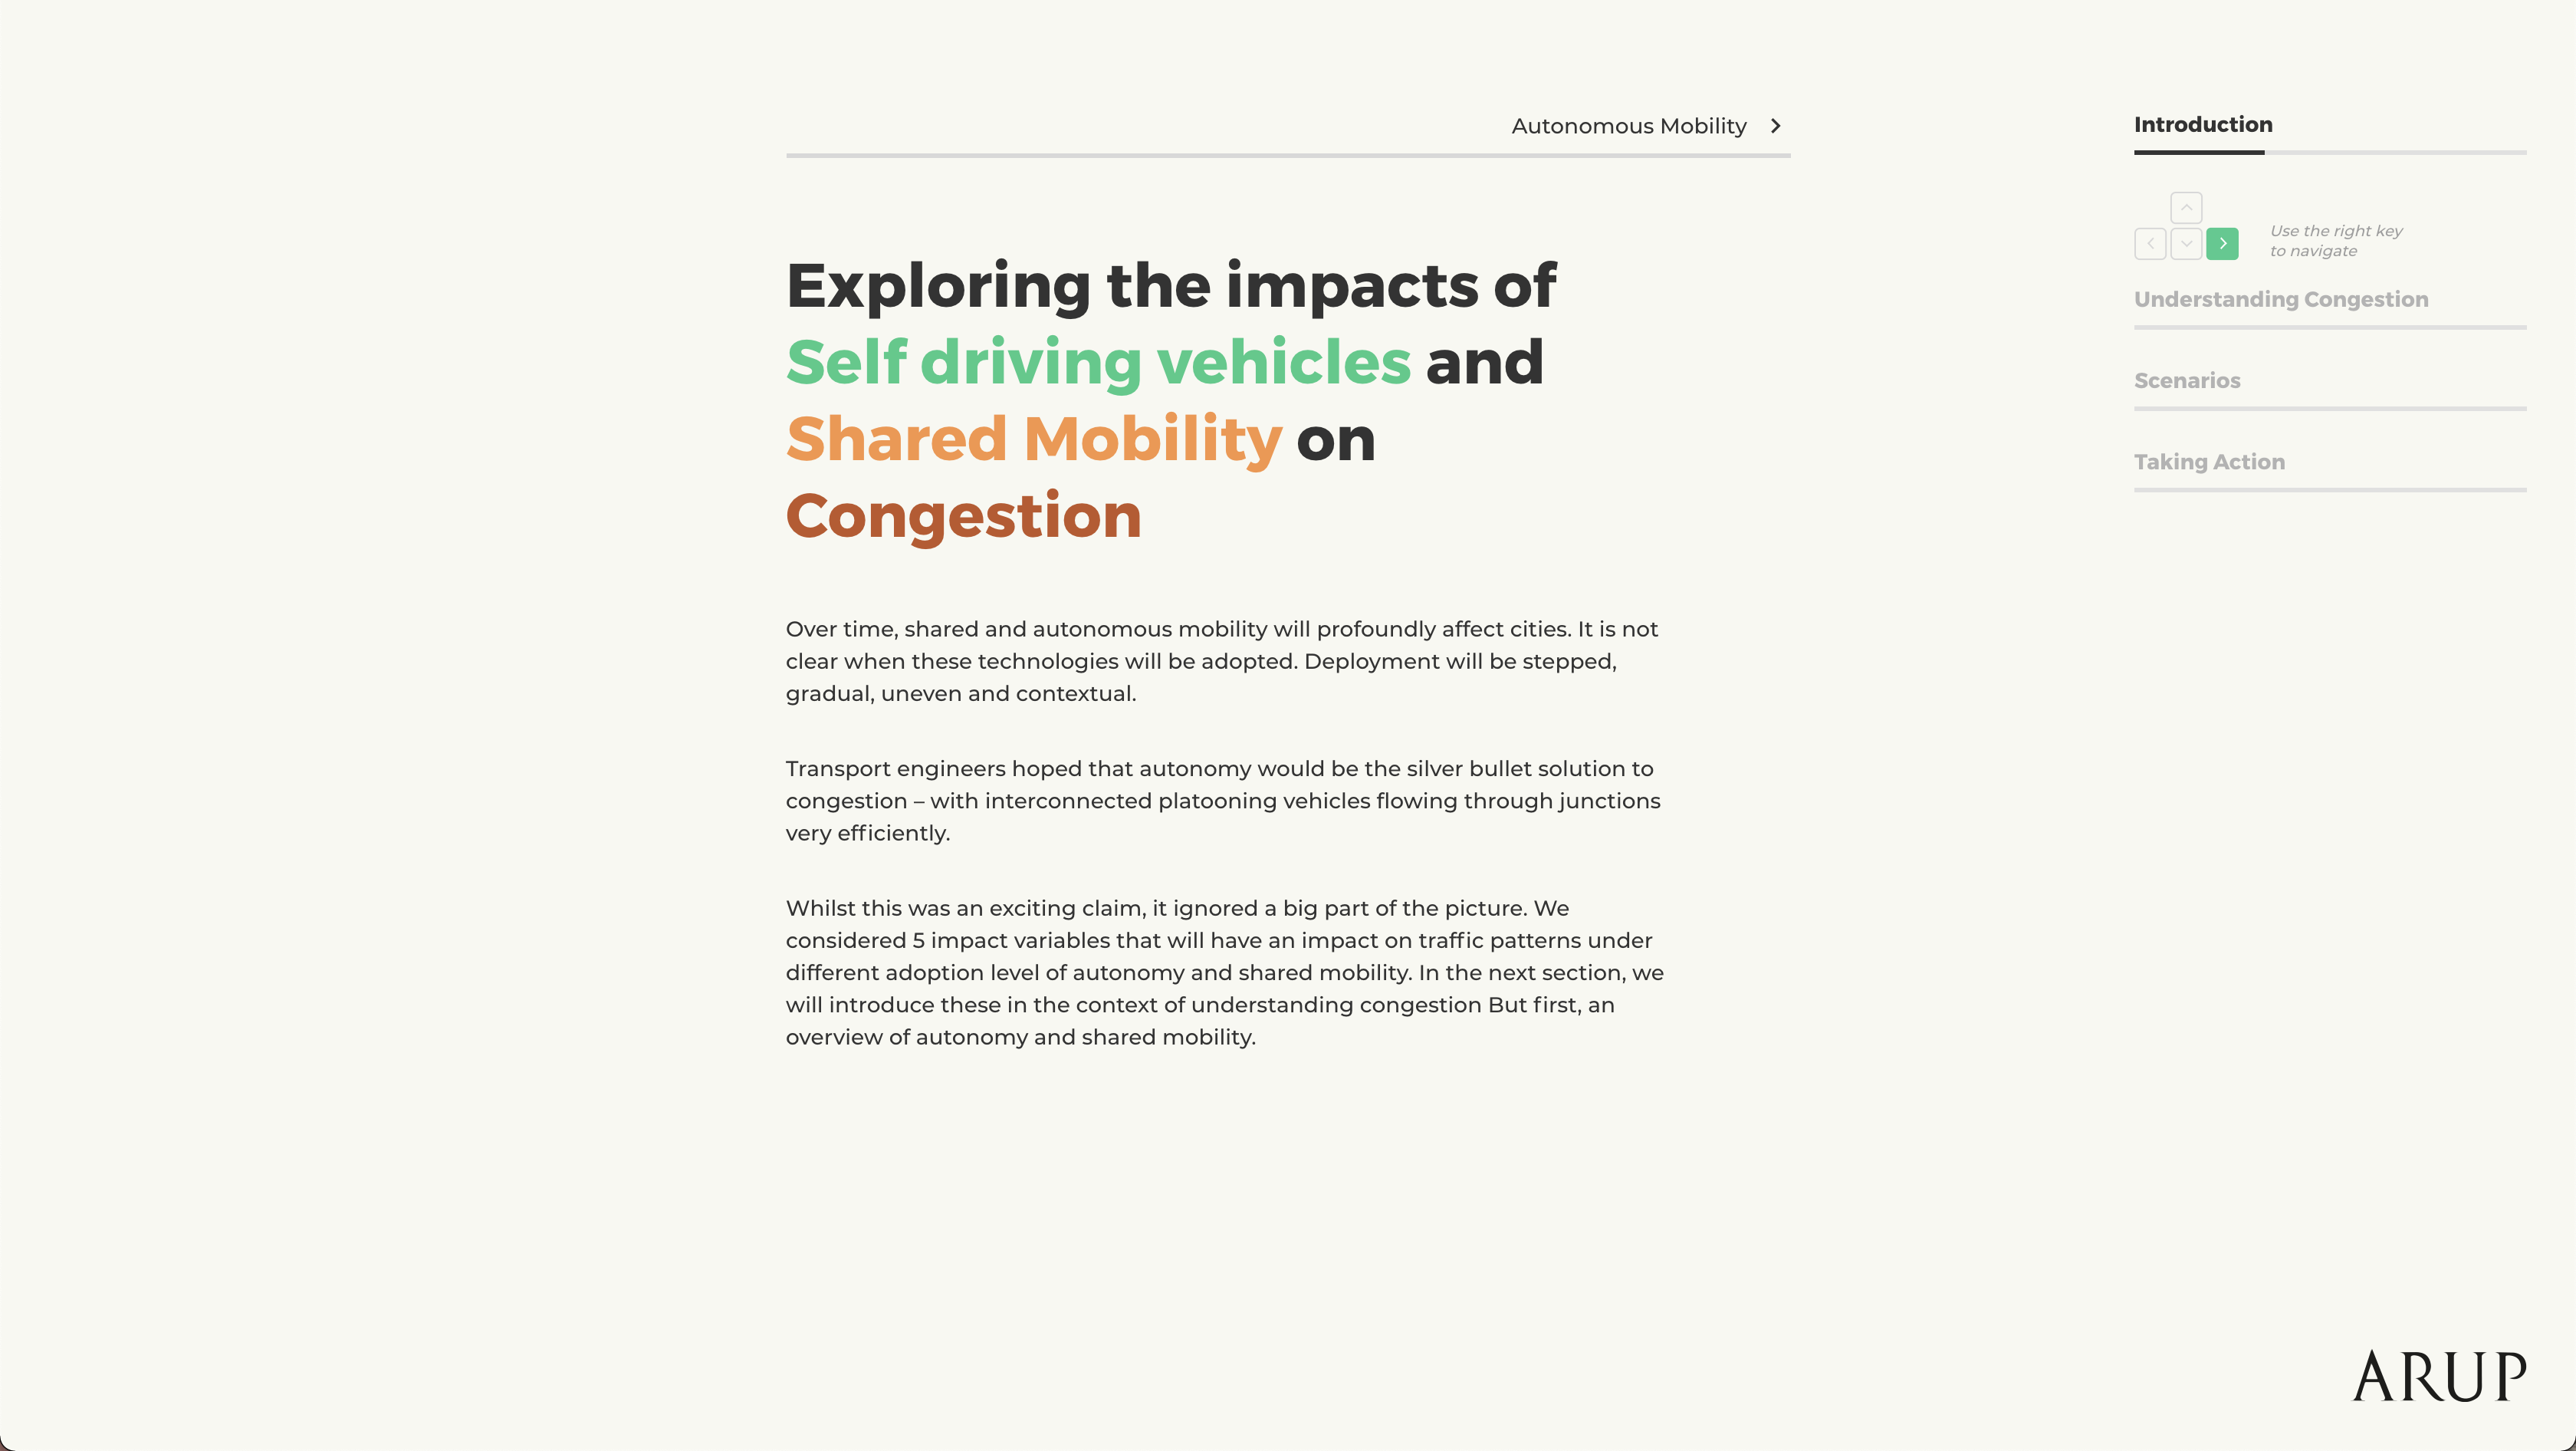
How do we begin to evaluate the impact of autonomous vehicles and shared mobility services on congestion? How do we embrace the uncertainty surrounding these new mobility technologies?
The visualisation
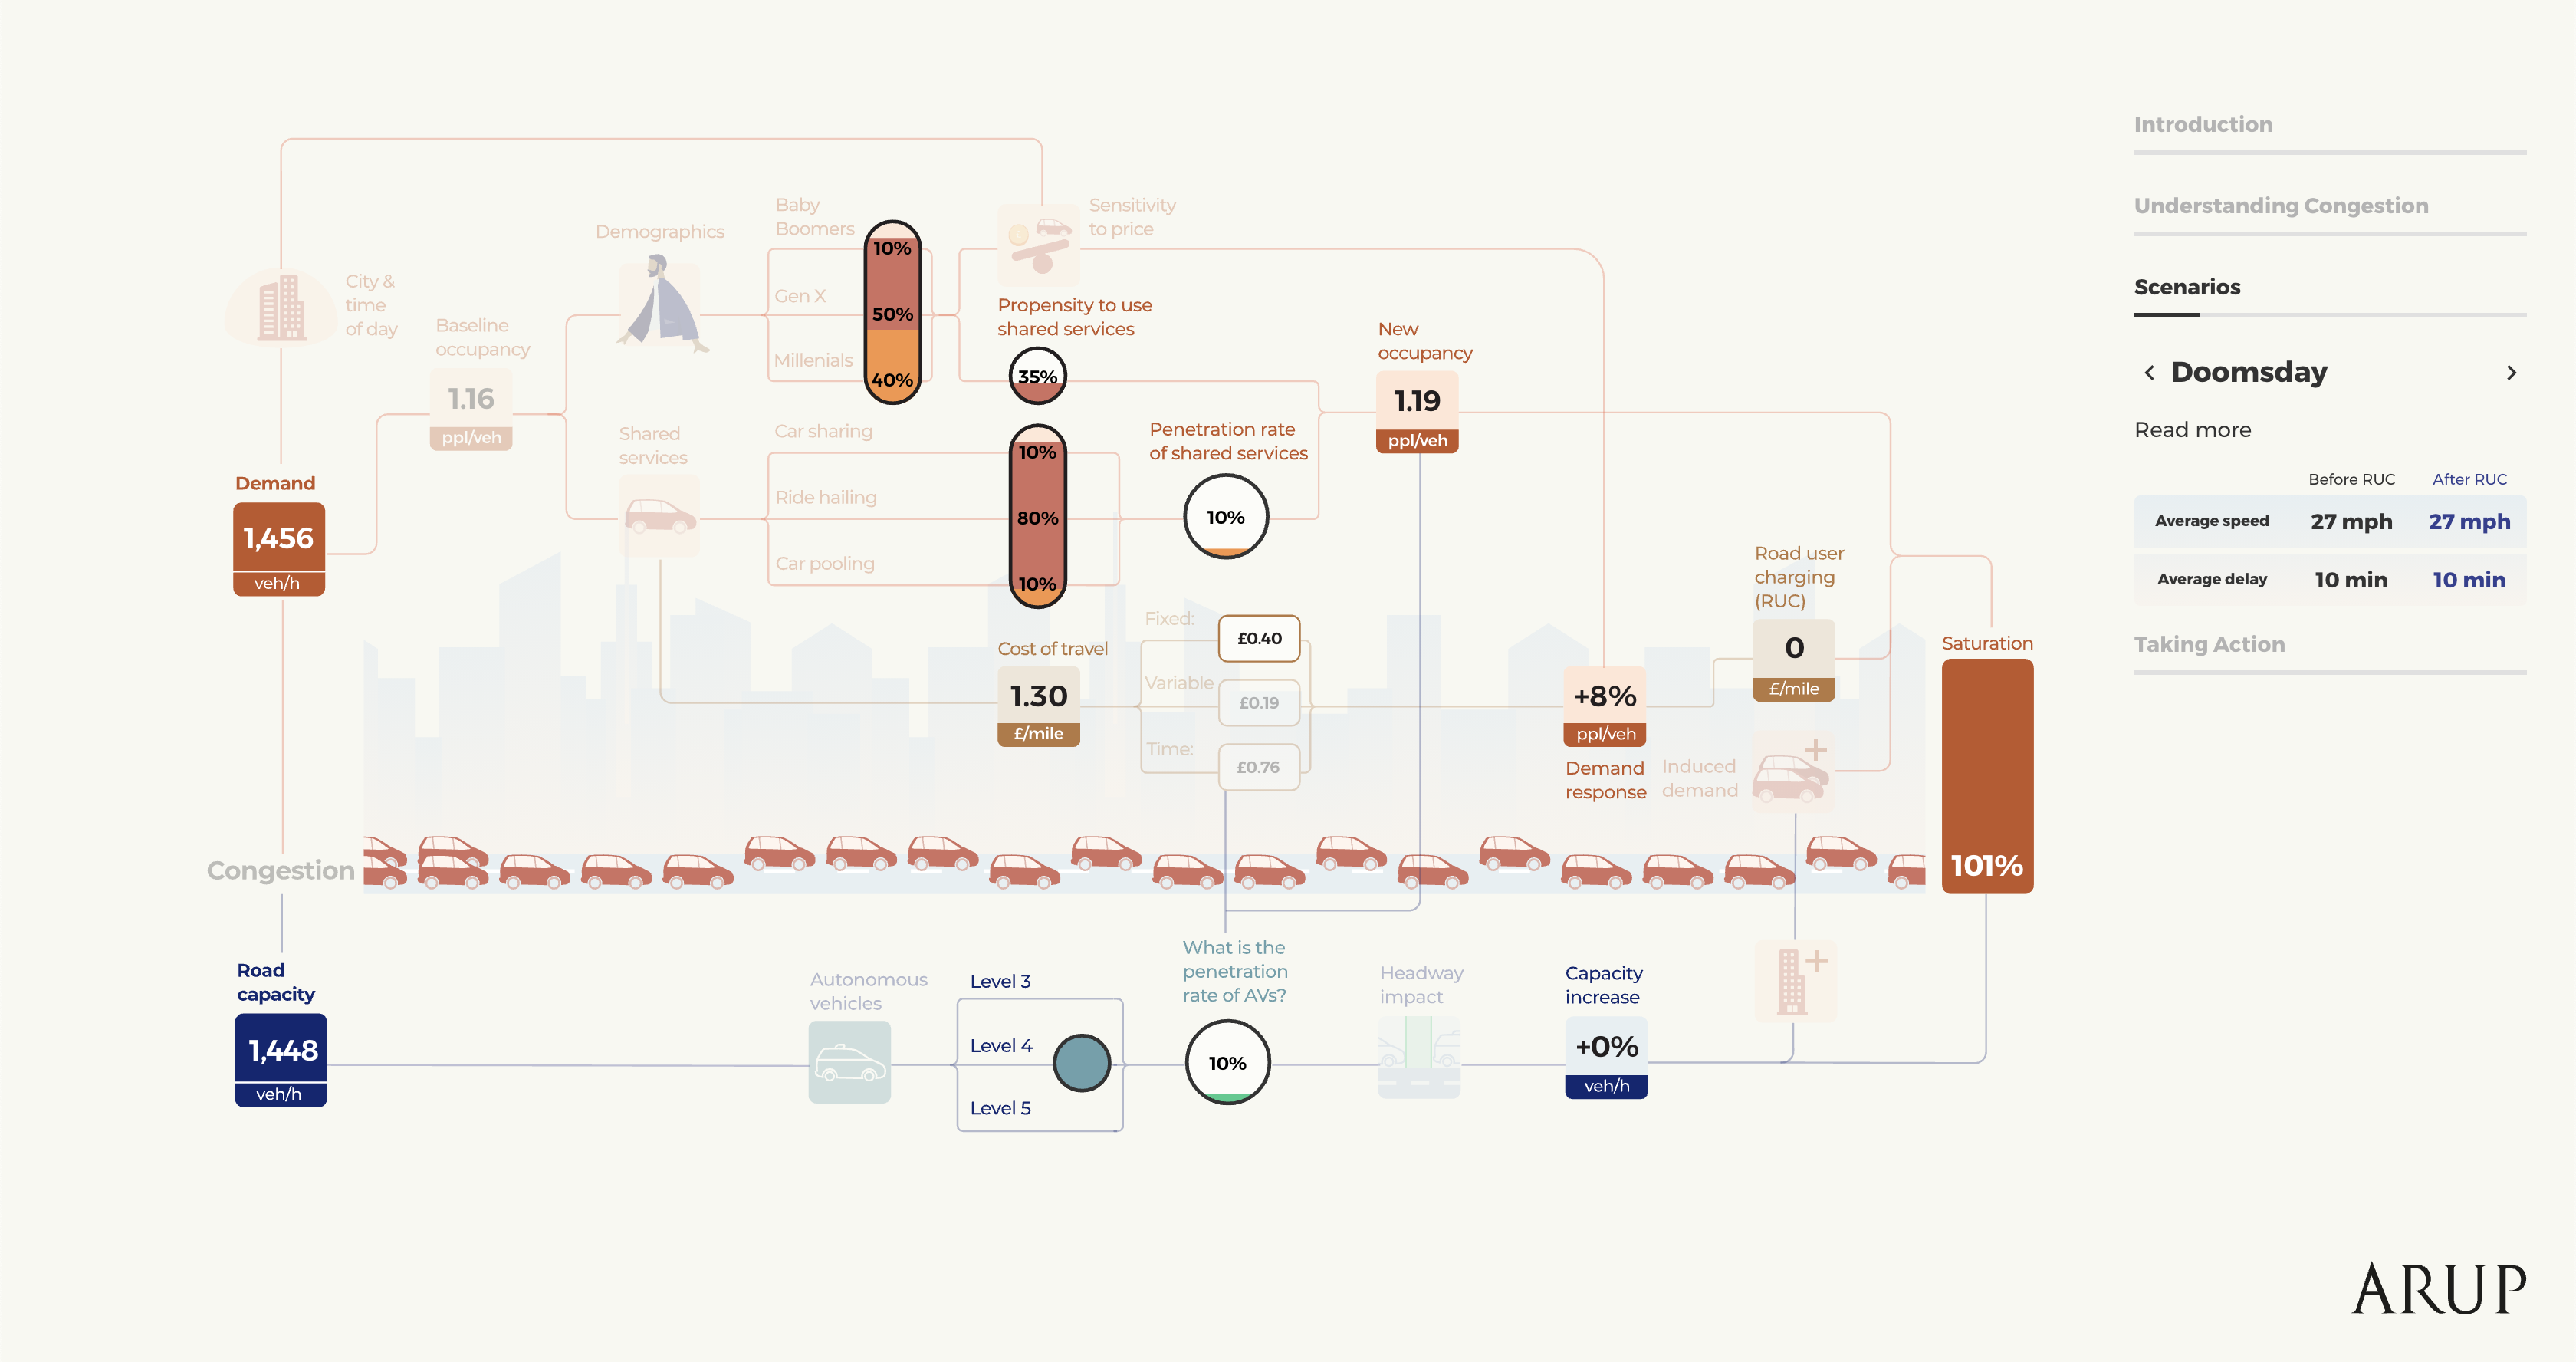
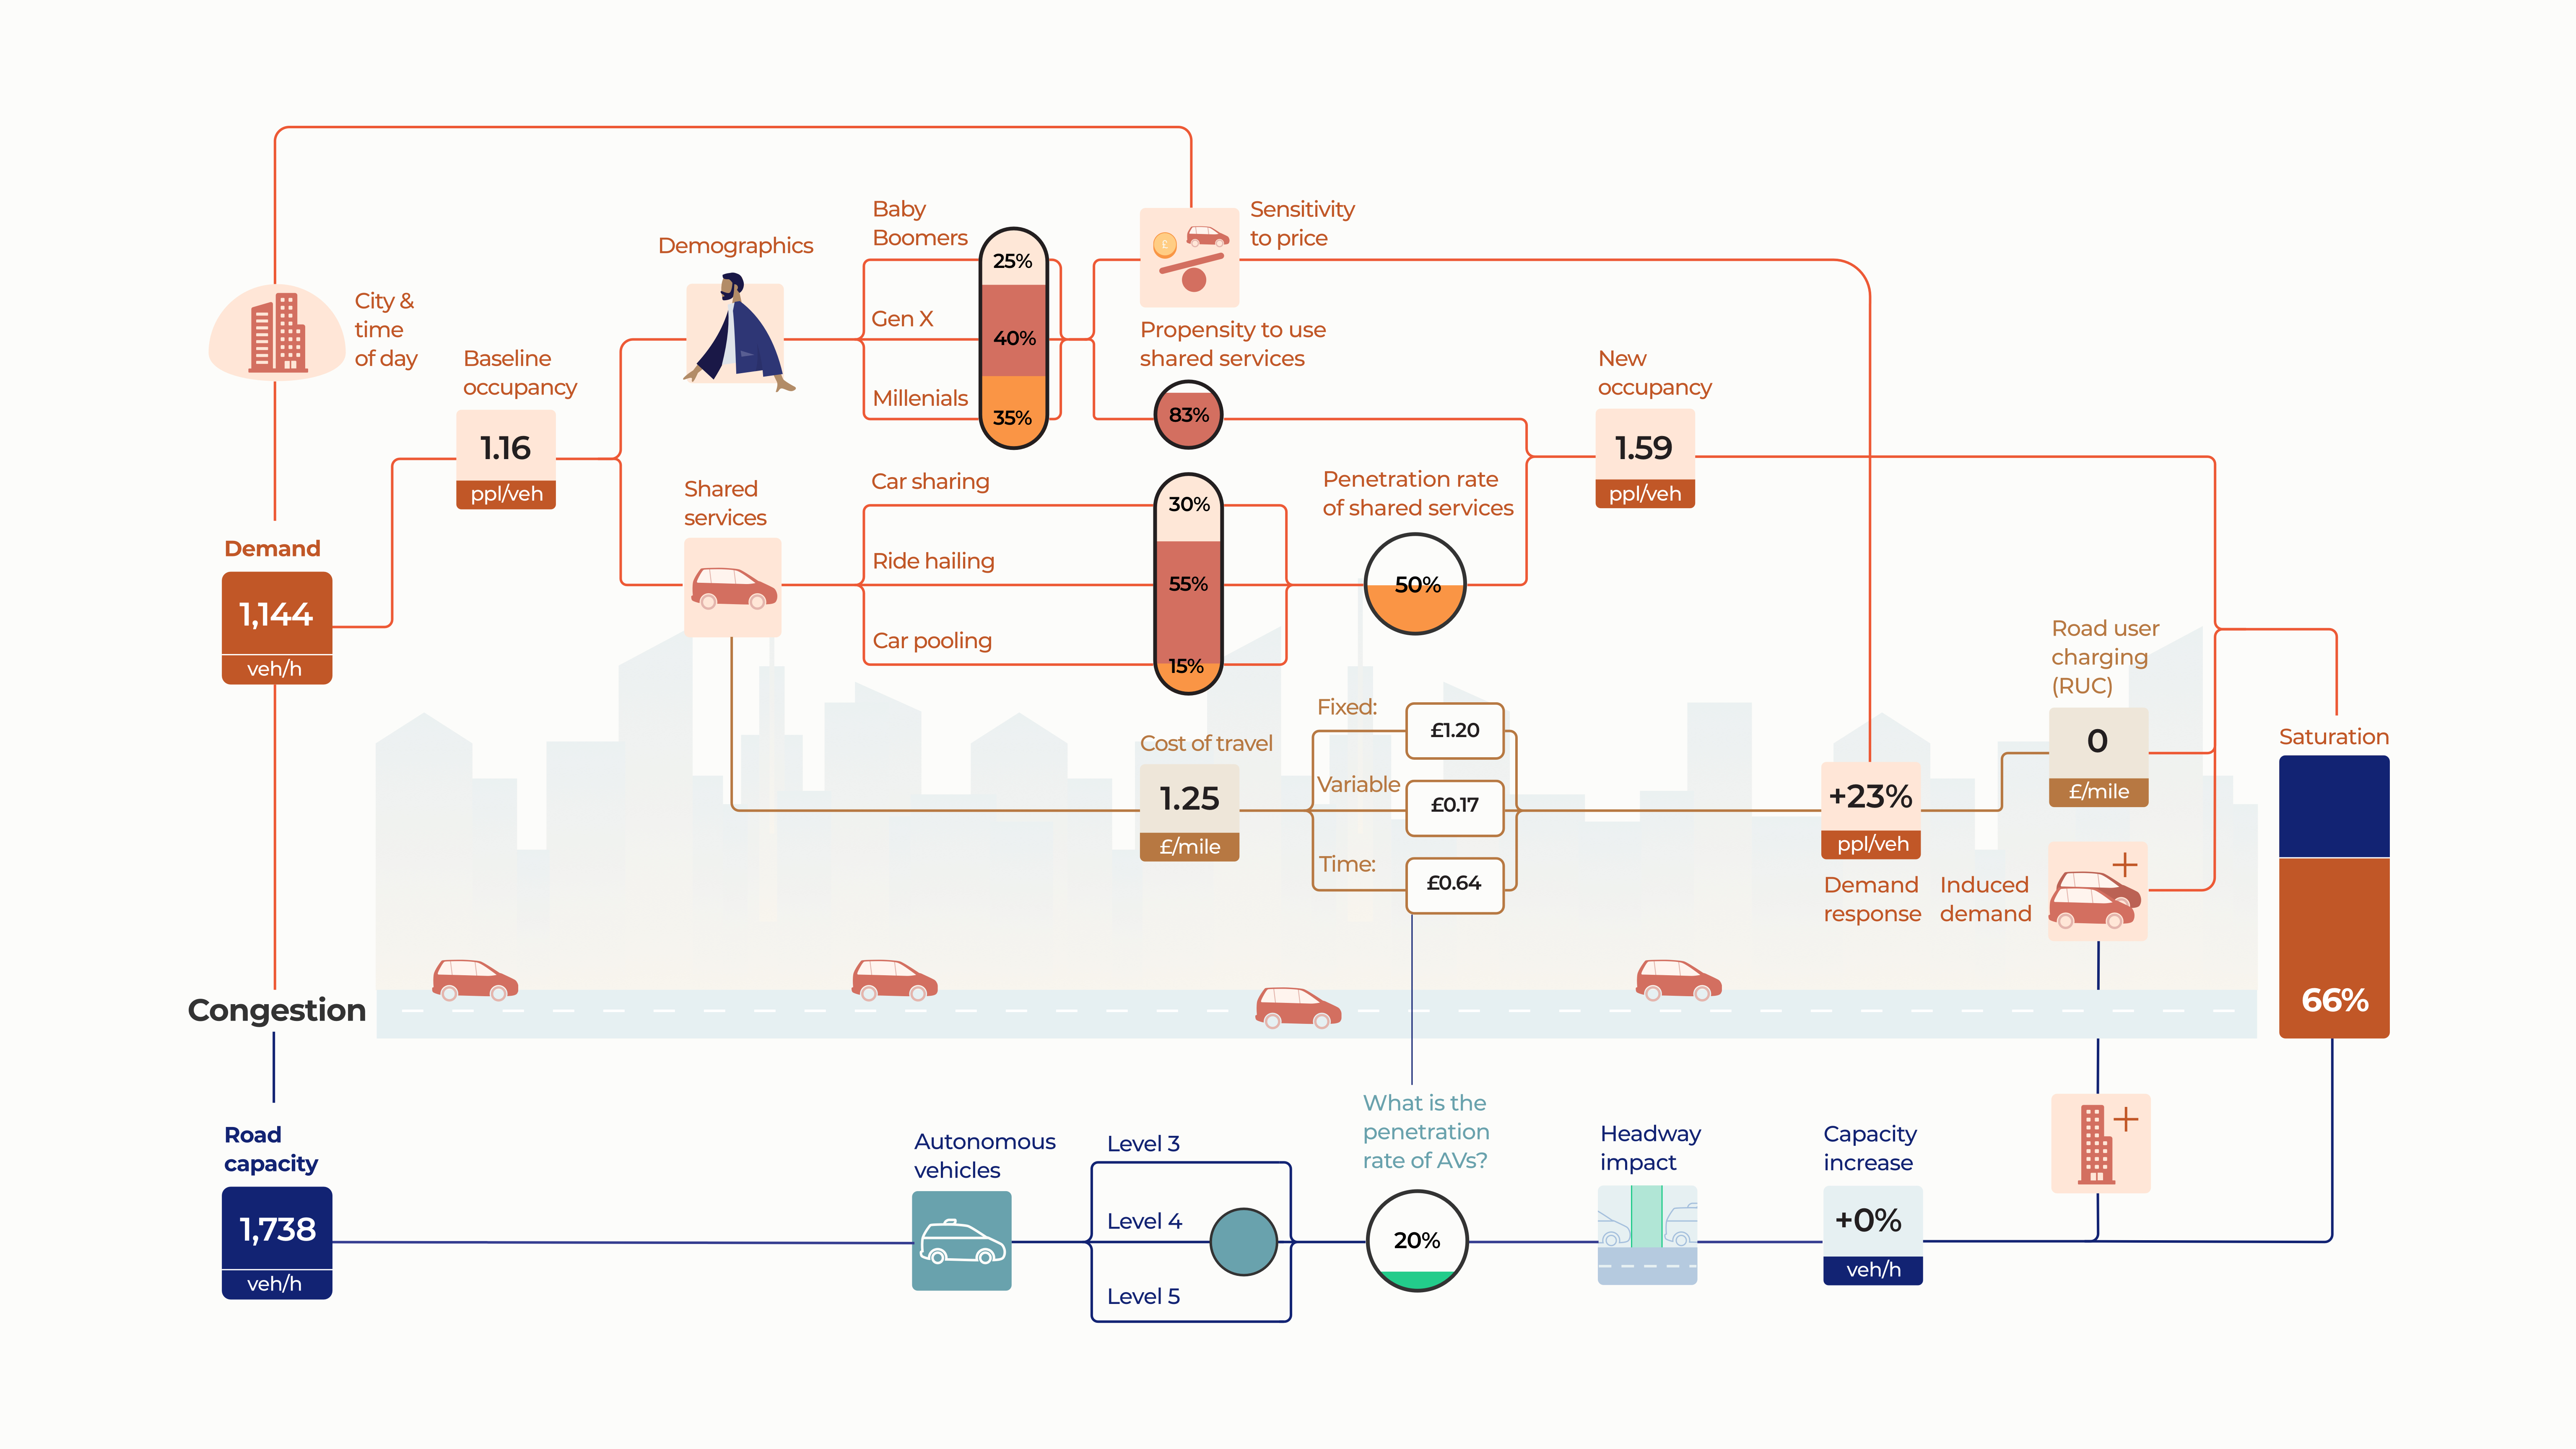
Arup made a visualisation that looks at some of the key factors that impact traffic patterns and explores the complex relationships between them.
By building on extensive research and data, including typical demand conditions in various cities, local propensities to use shared services, the costs of driving a car as well as socio-economic and cultural variables, it shows the magnitude of the impact that shared and autonomous mobility technologies will have on urban congestion.
︎︎︎Infografic design
My role
In a series of co-creation sessions, working closely with the Arup city economist who developed the model behind the visualisation and Arup web developers, we discussed and sketched many versions of how we might bring this story to life. The visualisation evolved through many iterations, until finally arriving at it’s final form.
The challenge was to highlight the links between the different factors that influence the number of cars on the road, and how different combinations could lead to what we called a doomsday scenario or a free flow scenario.